Kubernetes Container Monitoring
Overview
In this lab we will review how we can monitor container performance on Kubernetes environments by using the Prometheus interface available, and using eBPF to monitor the traffic generated by the containers. On top of it, we will map container metric data with flow data to enable metric to flow.
These are the steps that we will follow on this lab:
Enable SNMP on the Data Insight server
Add Data Insight device in the NMS to start monitoring
Import Data Insight Kubernetes Monitoring RNA workflow and deploy it to monitor container performance
Enable netobserv in Data Insight
Import Data Insight eBPF Flow Mapping RNA workflow to map metric data to flow data
Create TopN views and Data Insight reports to show data collected
Enable SNMP on Data Insight and Add DI to NMS
Go to TechZone reservations
Open the reservation SevOne - NPM Lab with IBM Rapid Network Automation
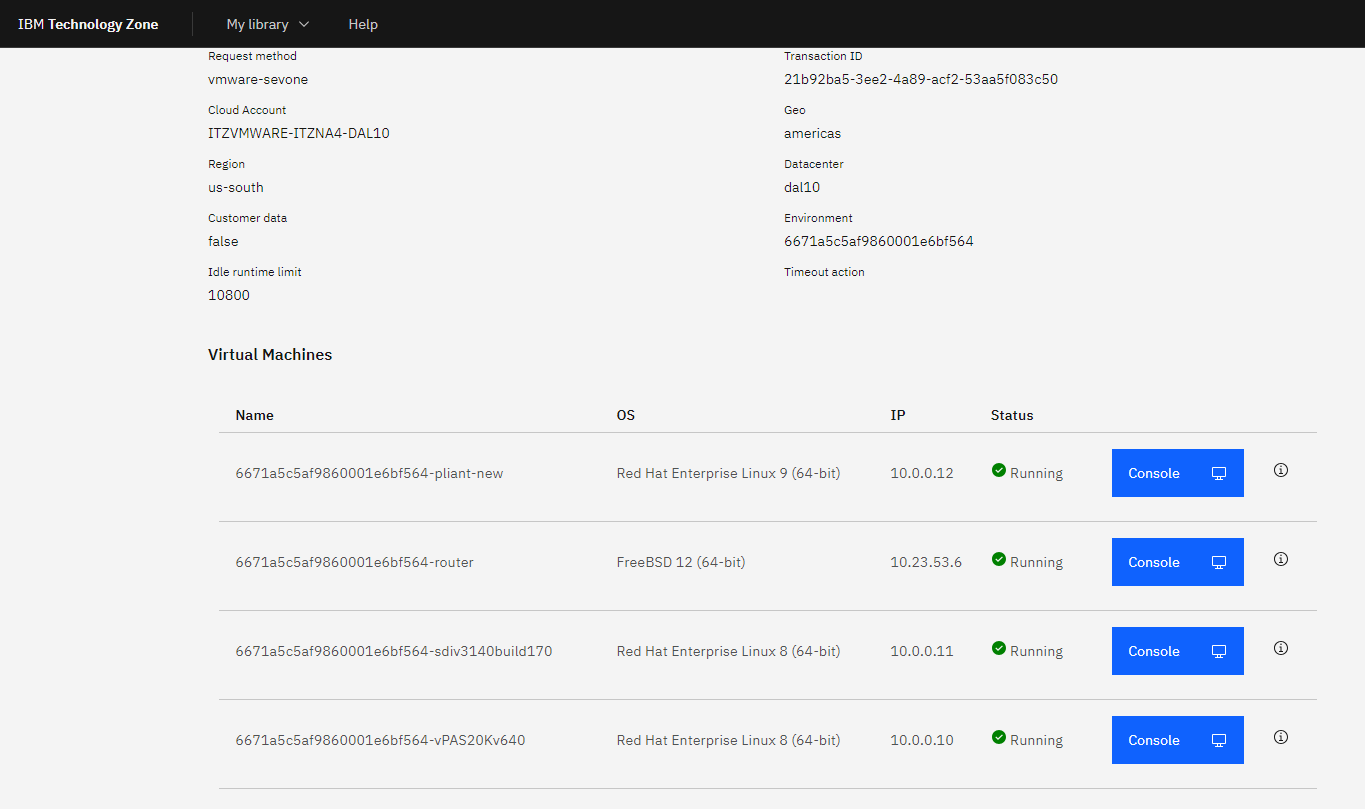
Scroll down until you see the sdi virtual machine (currently running Red Hat Enterprise Linux 8) with IP 10.0.0.11
Open the Console
Click Open in a new window
a. sevonek8s login: sevone
b. Password: dRum&5853
c. Execute:
1. sudo su

2. systemctl enable snmpd

3. systemctl start snmpd
Go to the GUI of the NMS
Go to Devices -> Device Manager
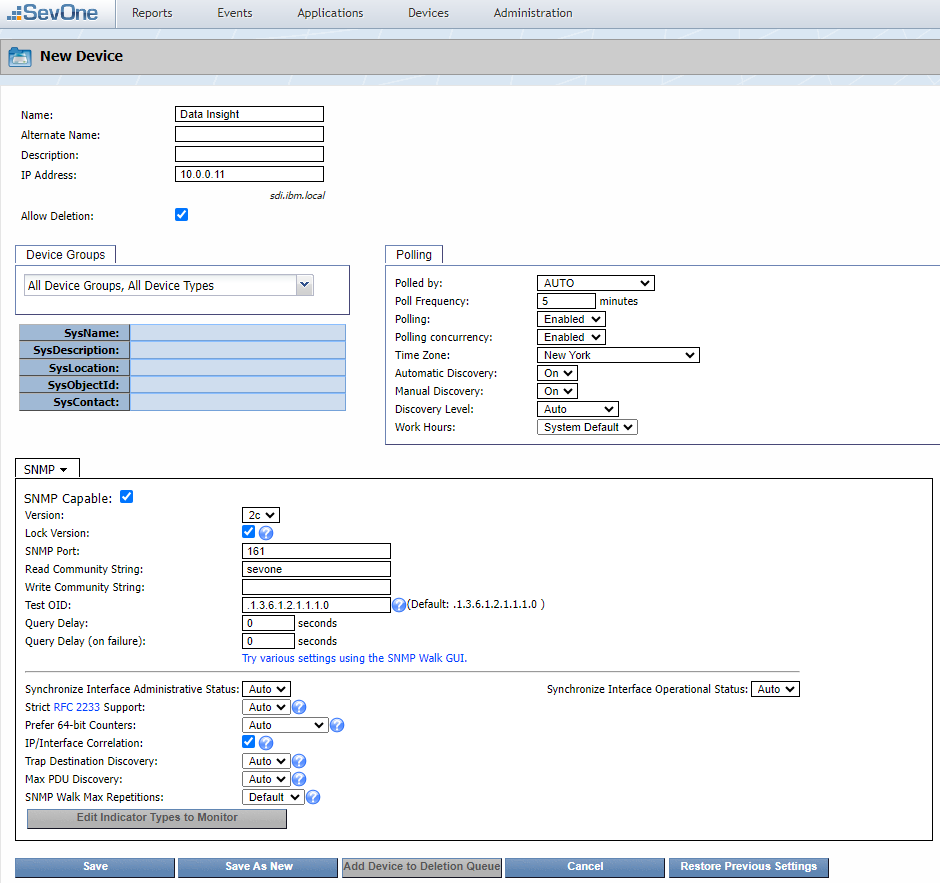
Click Add Device
a. Name: Data Insight
b. IP Address: 10.0.0.11
c. SNMP
i. Read Community String: sevoned. Click 'Save As New'
- Wait a few minutes to start seeing data coming in
Kubernetes Container Monitoring
If SevOne authentication has already been created, please skip this block of actions and continue to step 13.
Log into RNA
Go to Authentications
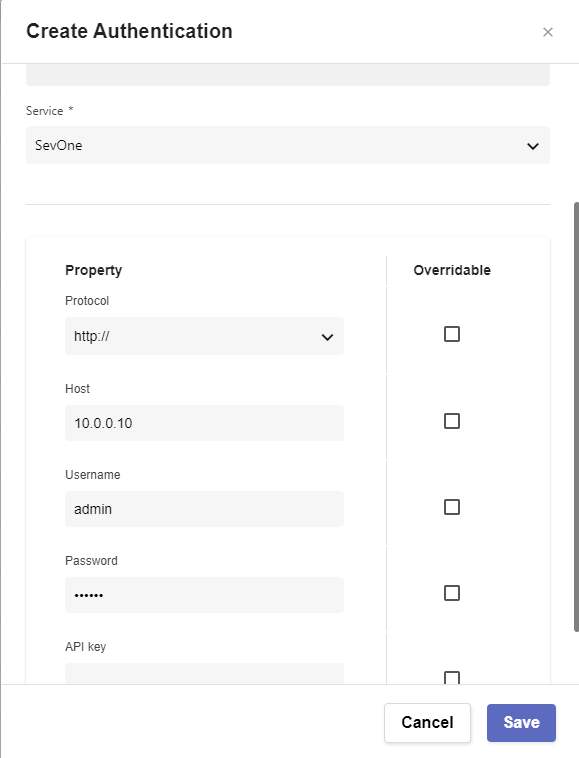
Click Create Authentication
a. Name: SevOne
b. Service: SevOne
c. Protocol: http:// (<-- important)
d. Host: 10.0.0.10
e. Username: admin
f. Password: SevOne
Go to Workflows
Click on Import
a. Import K8s_DI_Monitoring_Flow_Mapping.zip file Download Workflow from IBM Community
Open workflow SevOne Data Insight Monitoring
a. Expand Start and make sure the following variables have values
i. token: default token (using datainsight:datainsight converted to basic64) is "ZGF0YWluc2lnaHQ6ZGF0YWluc2lnaHQ=". If a different combination of user and password is used in a differen DI platform, the new token will need to be converted https://www.base64encode.org/
ii. url: targets the prometheus interface of the DI server "https://10.0.0.11/prometheus". If a different DI system is used, please make sure Prometheus is enabled and the IP is correct
iii. NMSCredentials: use the credential configured on step 12 "admin/SevOne" to connect to the SevOne platform to ingest the data (you might need to go to another page)
Click Run to make sure the workflow works properly
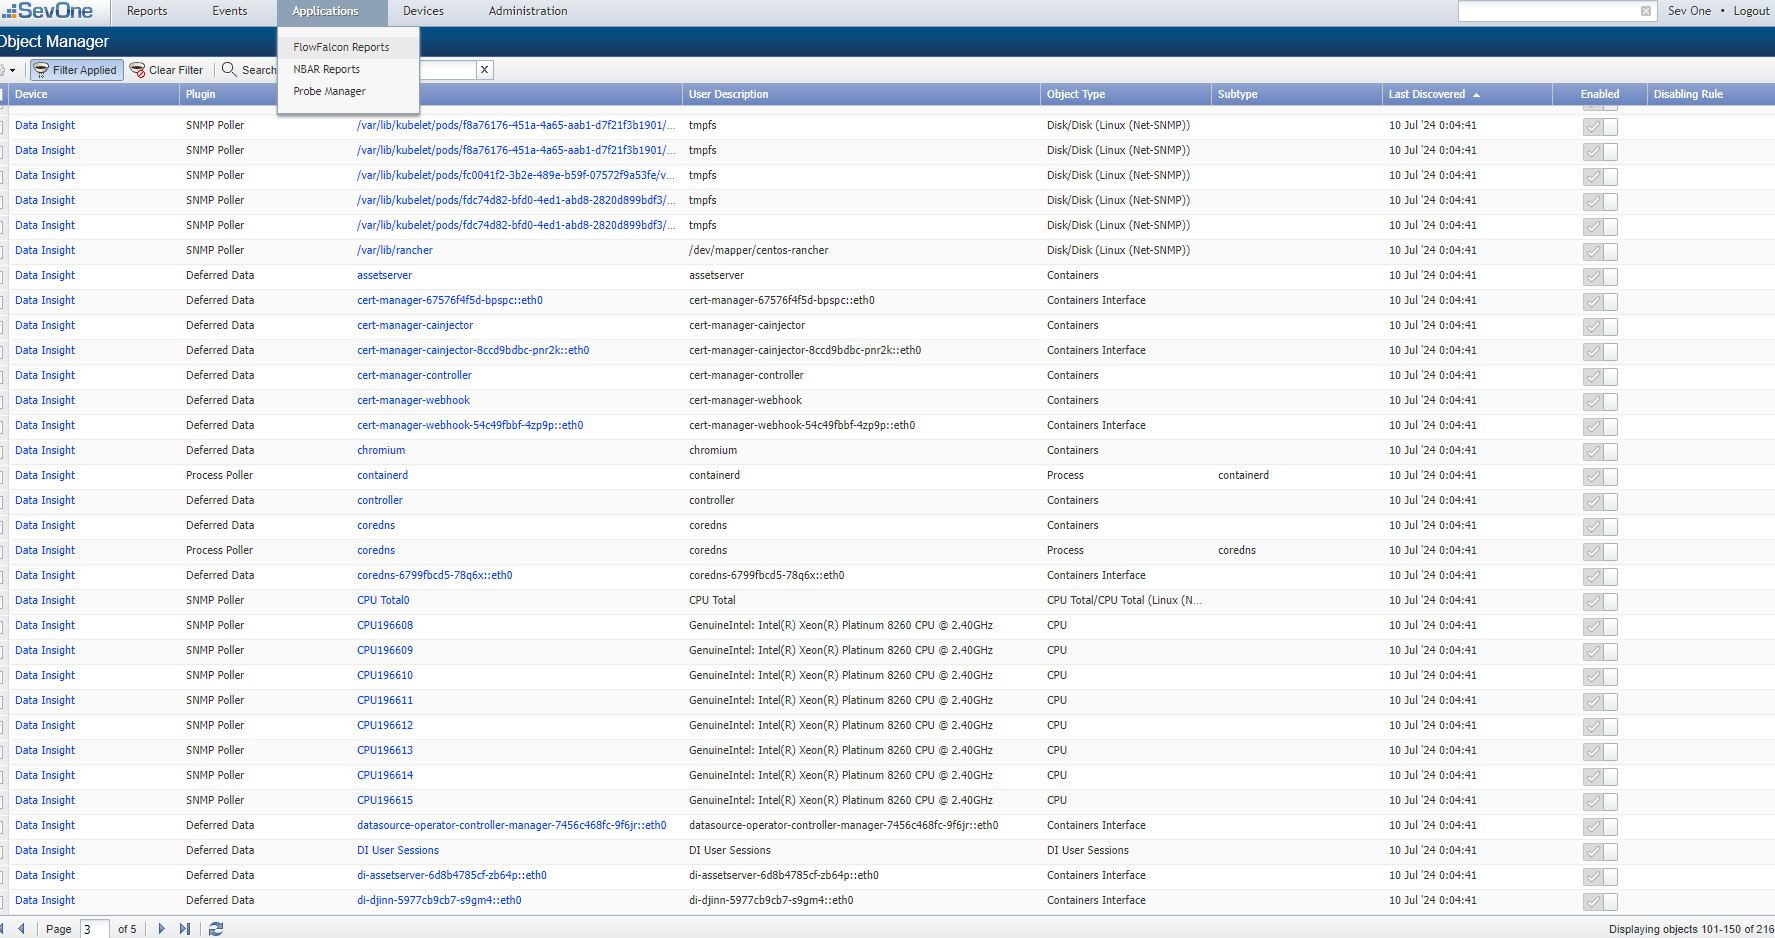
a. Go to the NMS
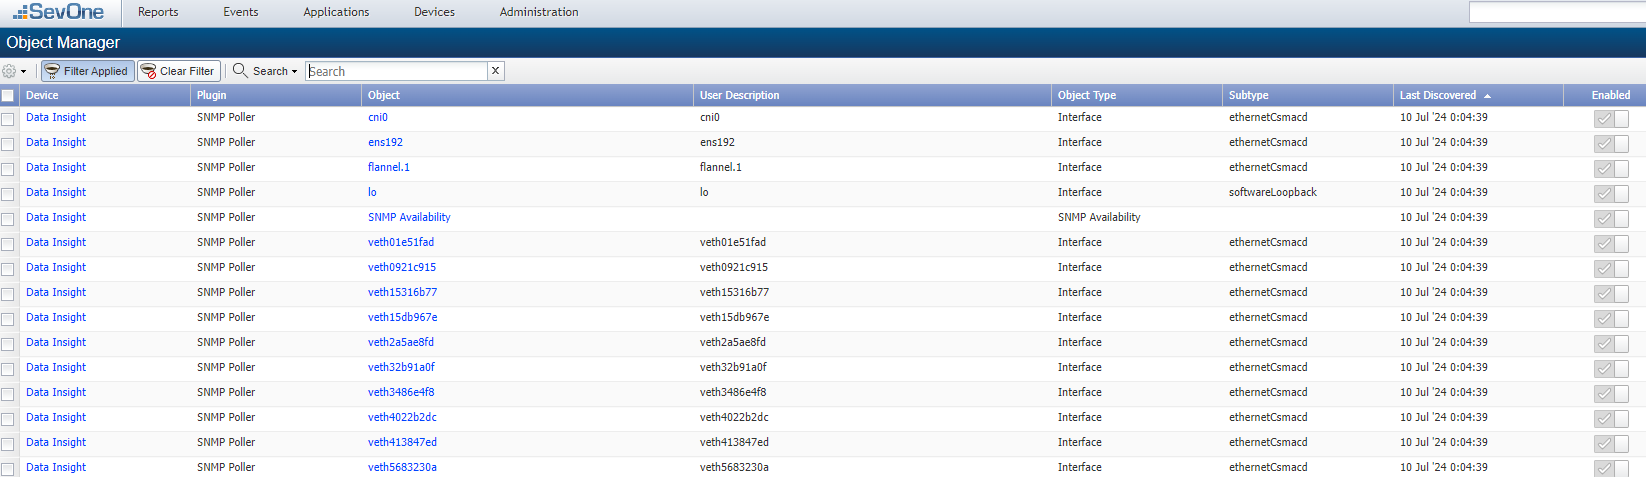
b. Go to Devices -> Device Manager
c. Open device Data Insight and go to Object Manager, new objects should have been created
Go to JOBS
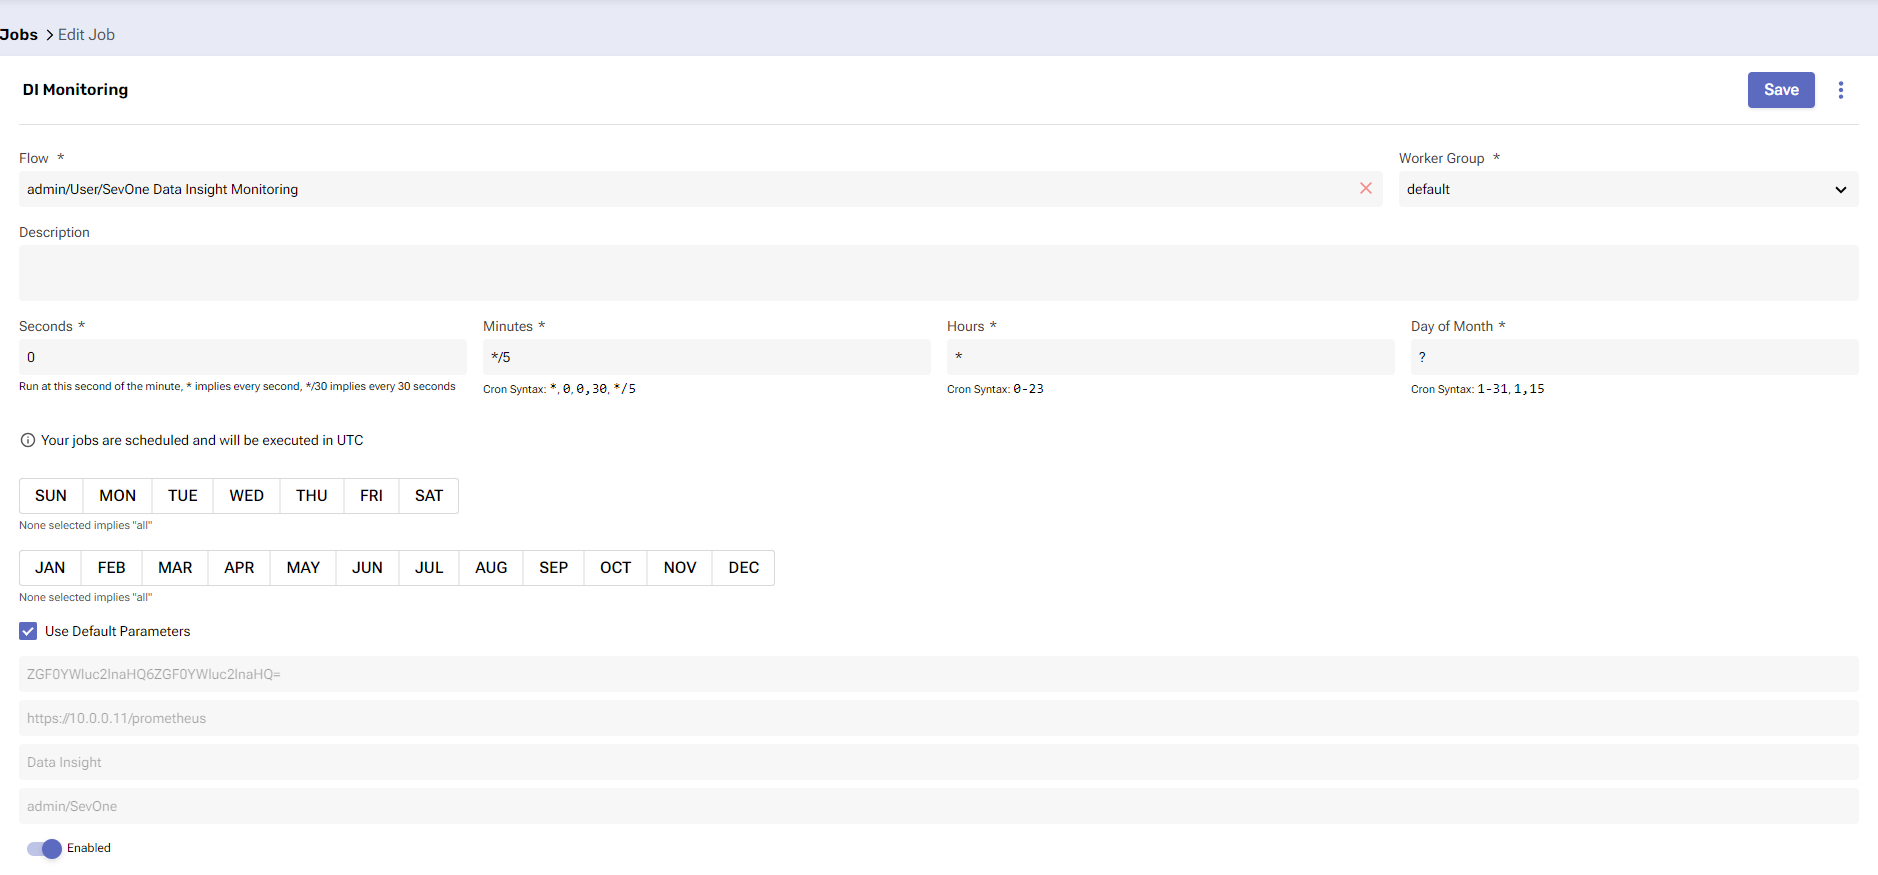
Click 'Create Job'
a. Flow: SevOne Data Insight Monitoring
b. Worker Group: default
c. Seconds: 0
d. Minutes: */5
e. Hours: *
f. Day of Month: ?
g. Use Default Parameters: Enabled
h. Enabled
Enable eBPF in Data Insight k8s Cluster
Go to TechZone reservations
Open the reservation SevOne - NPM Lab with IBM Rapid Network Automation
Scroll down until you see the sdi virtual machine (currently running Red Hat Enterprise Linux 8) with IP 10.0.0.11
Open the Console
Click Open in a new window and execute the following commands
a. sudo su
b. cd /home/sevone
c. kubectl config view --raw > kubeconfig.yaml
d. vi perms.yaml
e. Paste the content of this file Link to Box File
[Tip: use the 'Send Text' functionality available in the window]
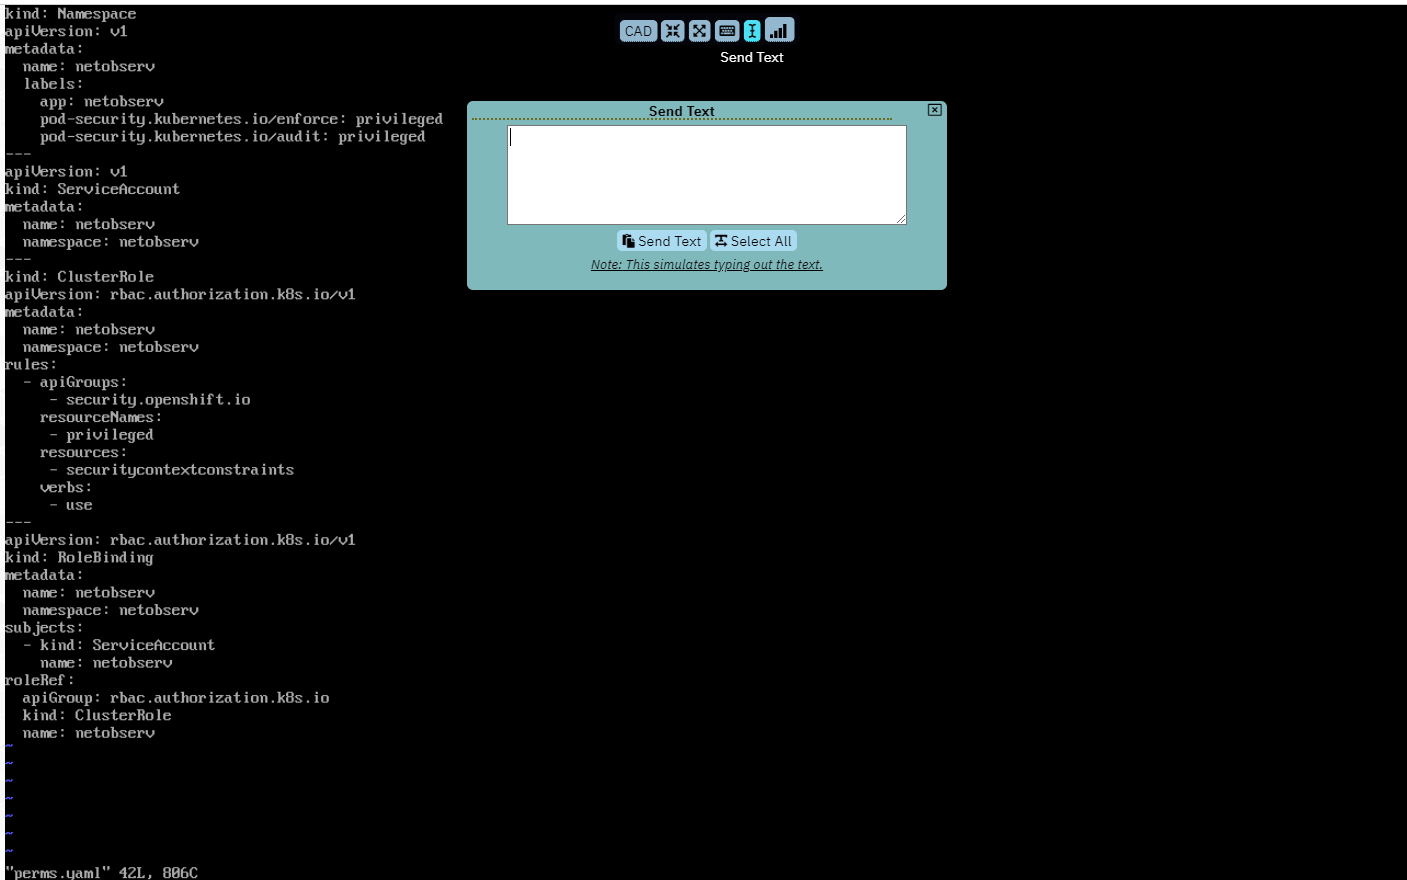
f. Press 'Esc' key and then type :wq! to save contents of the file
g. vi flp-daemonset.yaml
h. Paste the content of this file Link to Box File editing the following two values:
    i. line 97 -> KubeConfigPath: /home/sevone/kubeconfig.yaml

    ii. line 111 -> targetHost: "10.0.0.10"
IMPORTANT TIP: copy and paste small parts of the file otherwise the identation will not be respected and the file will not be correct
i. Press 'Esc' key and then type :wq! to save contents of the file

j. kubectl apply -f perms.yaml

k. kubectl apply -f flp-daemonset.yaml
After a couple of minutes, go back to the NMS
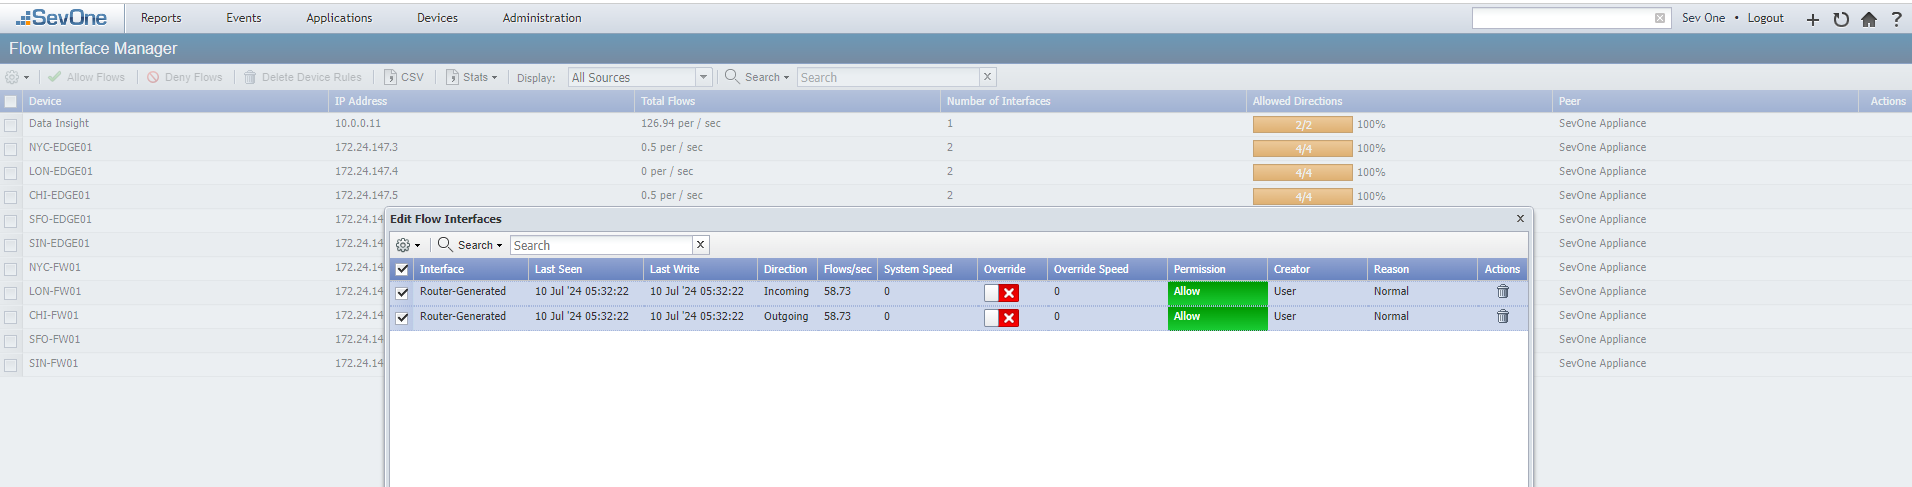
Go to Administration -> Flow Configuration -> Flow Interface Manager
a. Go to the Data Insight or 'Unknown' device and enable the flow data
Map Container Metric with Container Flow
Go back to RNA -> Workflows
Open workflow SevOne - Map All Container Interfaces
Expand Start and make sure that these variables have values:
a. NMSCredentials: "admin/SevOne"
b. devicename: "Data Insight"
Scroll down to the Map_Object_Incoming workflow and click on it to open Object Editor
No need to change anything here, but please review that different settings required to run this subworkflow
a. field: netflow field that we will use to create the filter that will allow us to assign a container to the traffic generated to that container
b. podname: name of the container that will be mapped to the flow data
c. indicatorname: indicator that will be mapped to the flow data
d. direction: 1 (inbound) or 2 (outbound)
e. flowview: default flow view assigned to the mapping
f. NMSCredentials: SevOne credentials used to connect to the SevOne platform
f. devicename: device where the containers (objects) are part of
Click Run to test it works
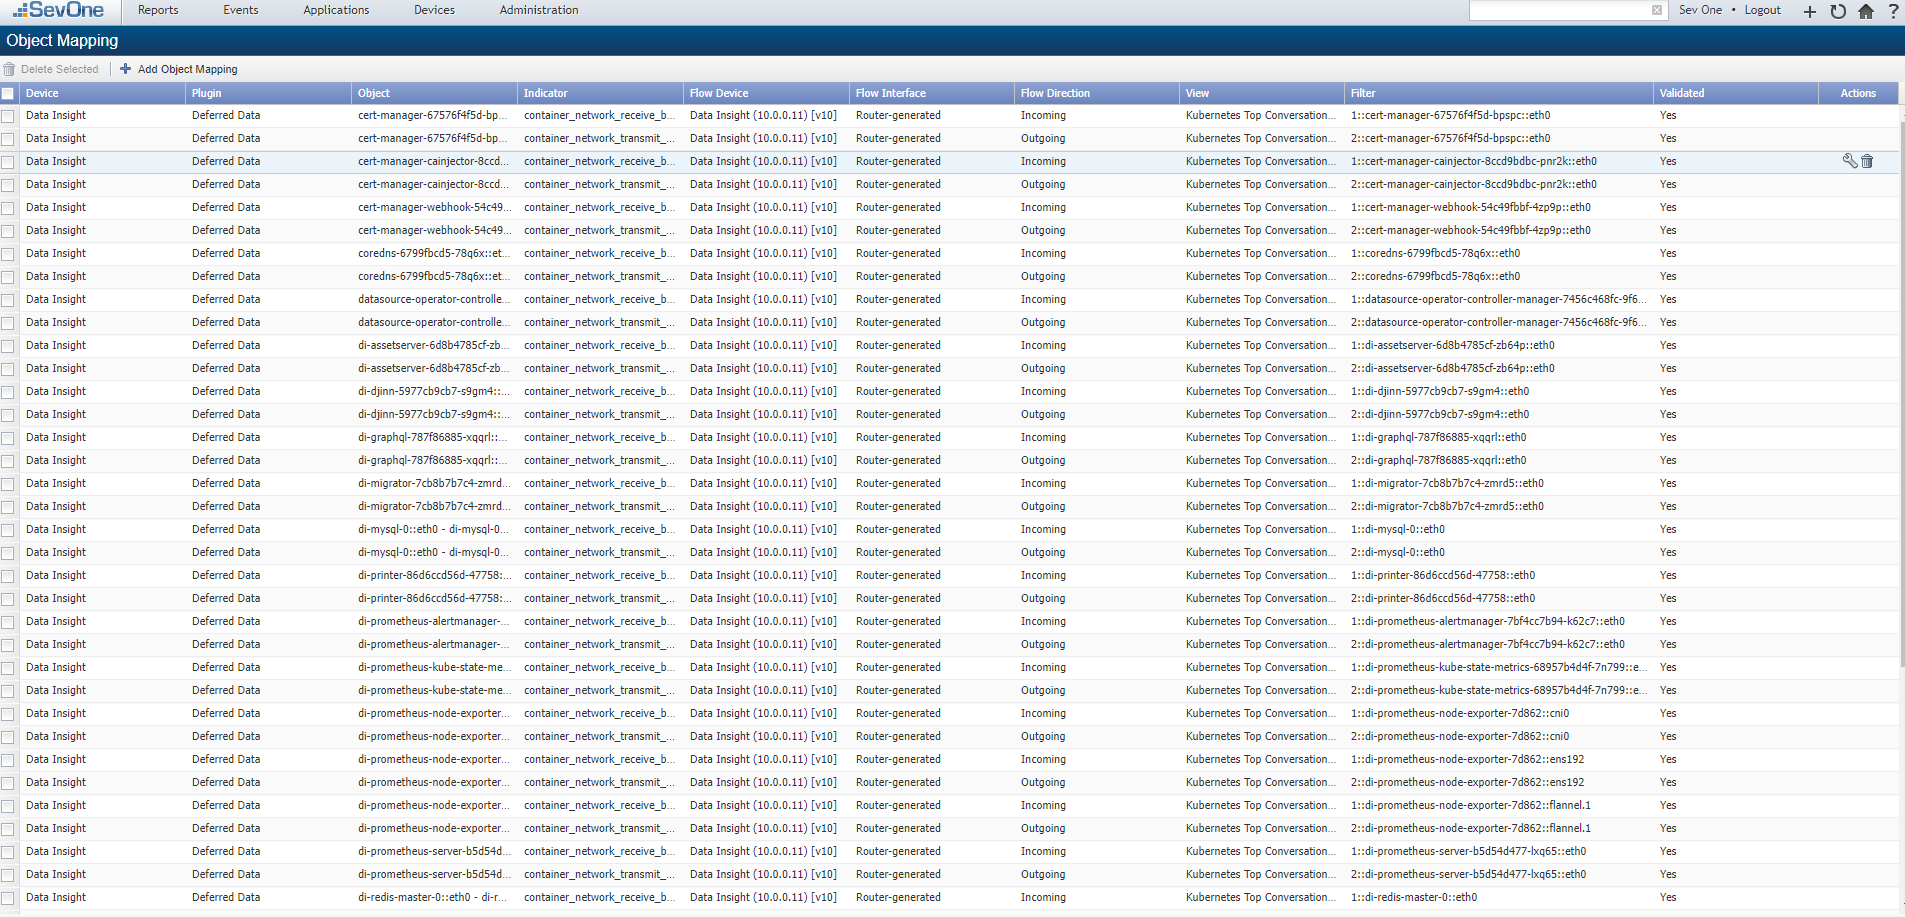
To confirm, go back to the NMS -> Administration -> Flow Configuration -> Object Mapping
Reporting
On the NMS, go to Reports -> TopN Reports
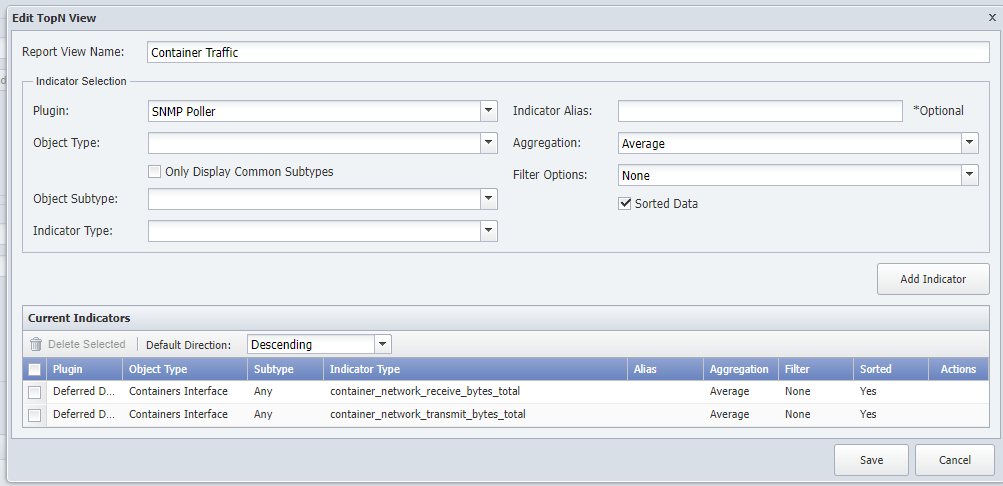
Click on Add View
a. Report View Name: Container Traffic
b. Plugin: Deferred Data
c. Object Type: Containers Interface
d. Only Display Common Subtypes: Disabled
e. Object Subtype: Any
f. Indicatory Type: container_network_receive_bytes_total
g. Click Add Indicator
h. Indicatory Type: container_network_transmit_bytes_total
i. Click Add Indicator
j. Click Save
Go to DI
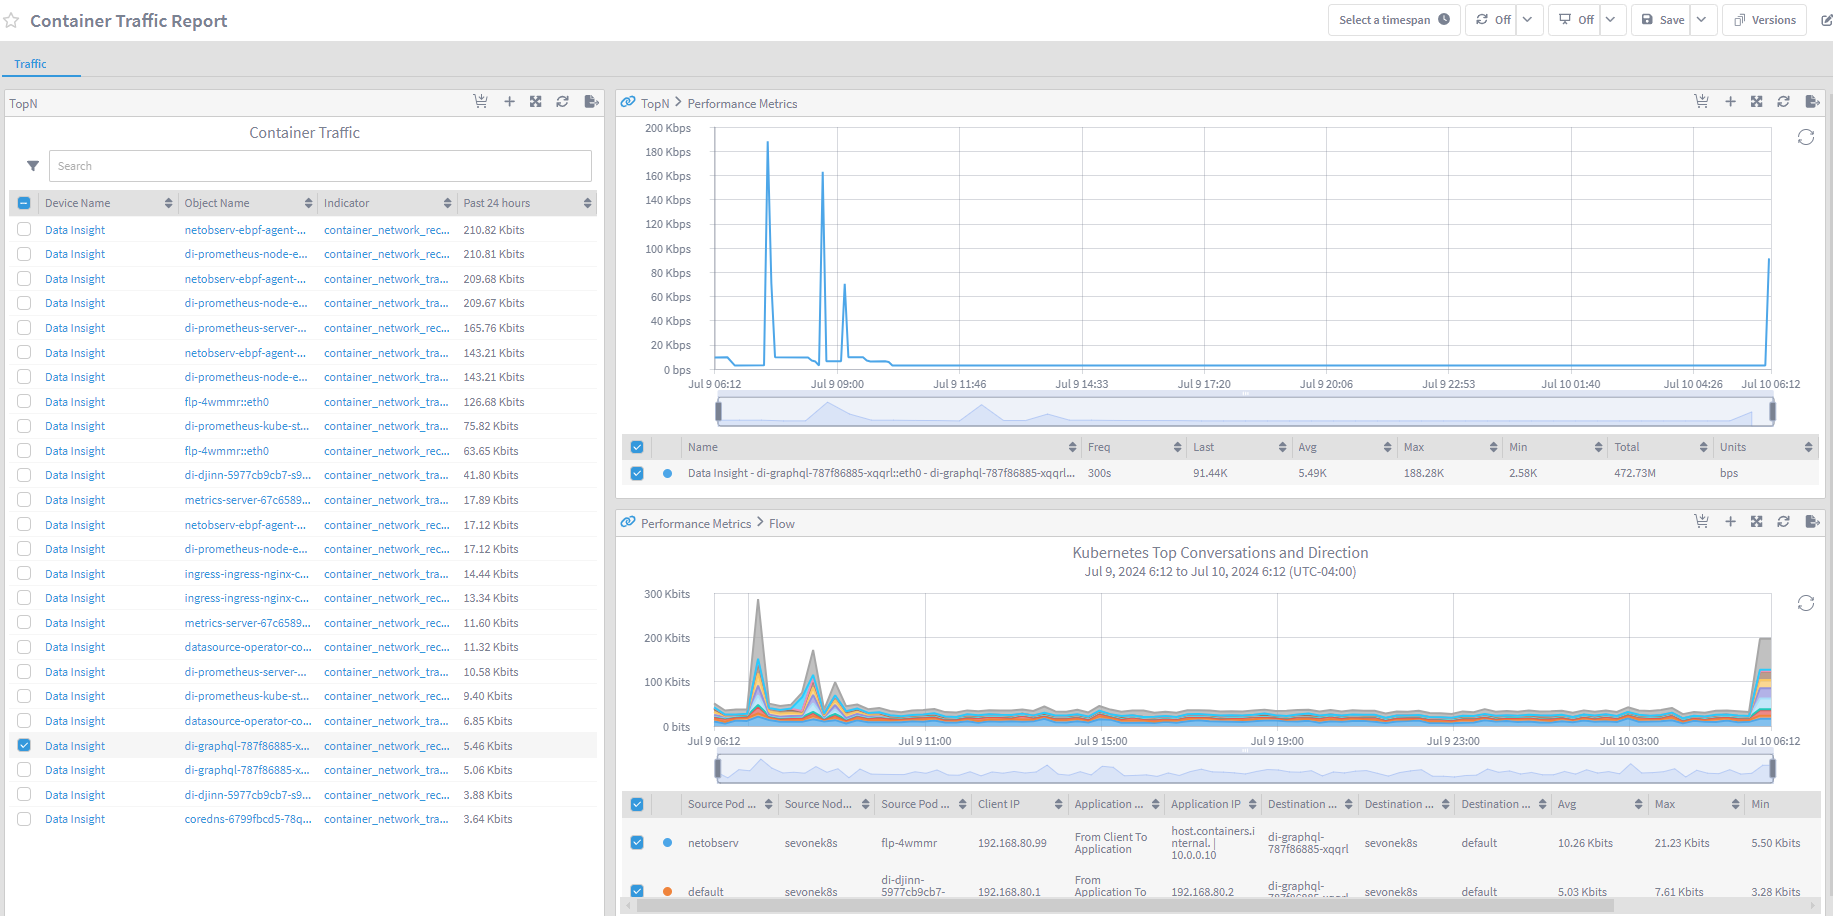
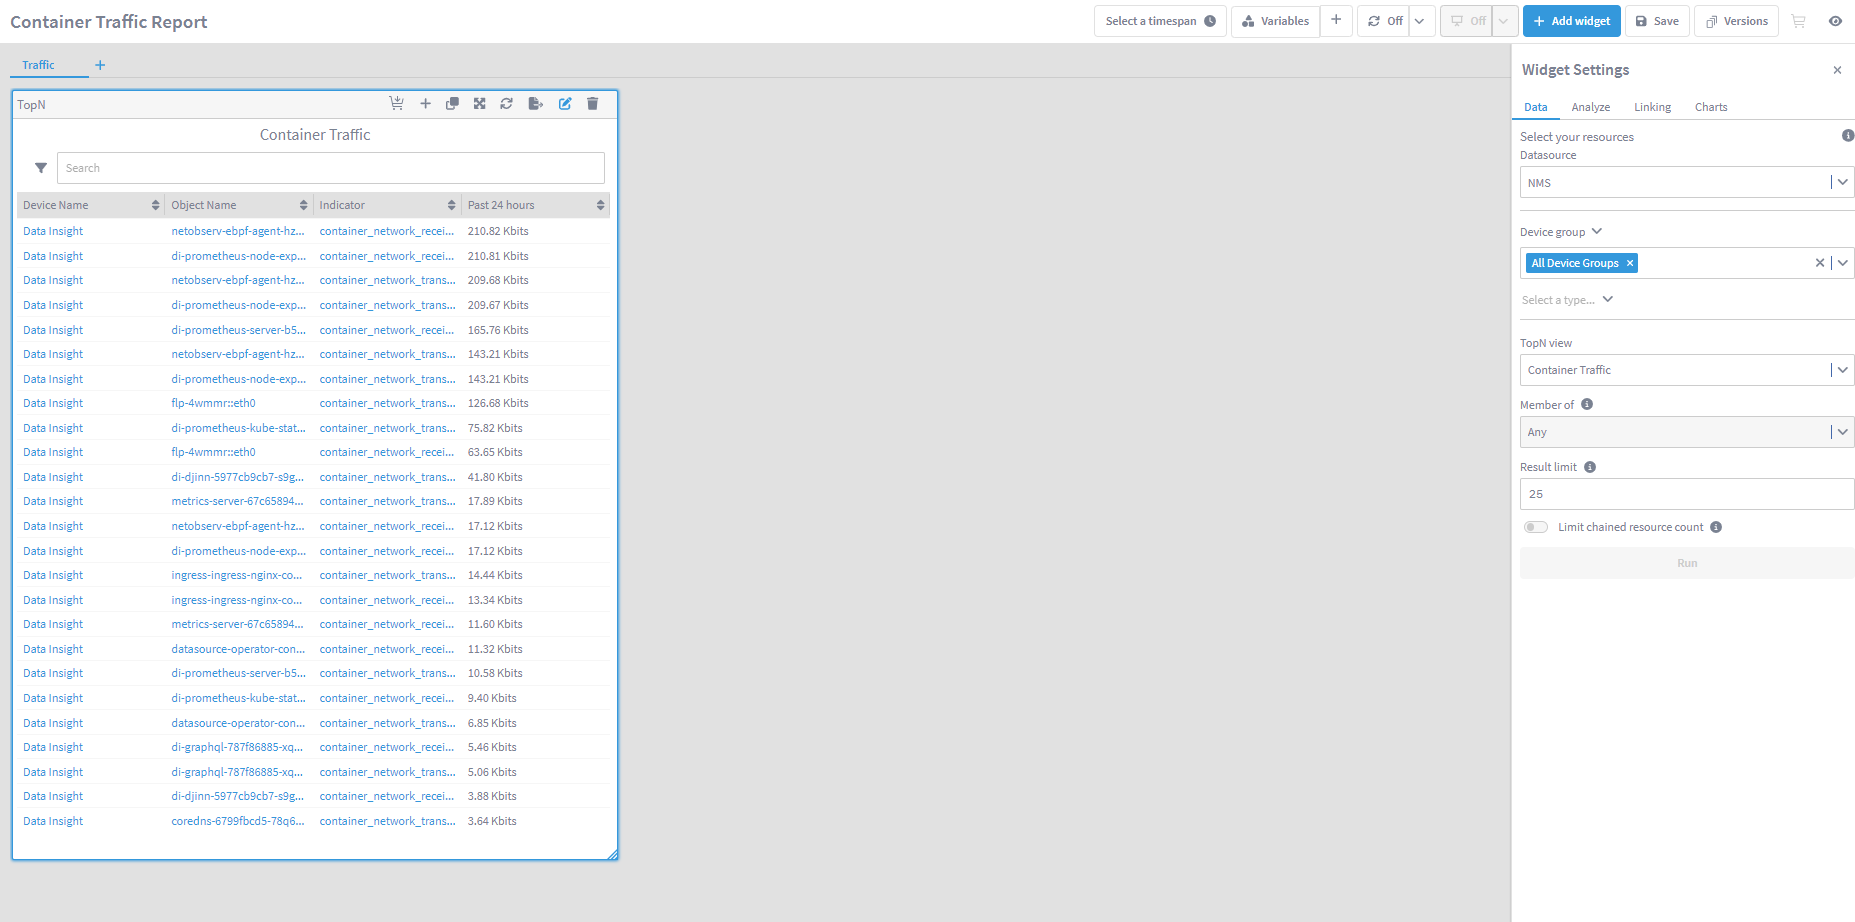
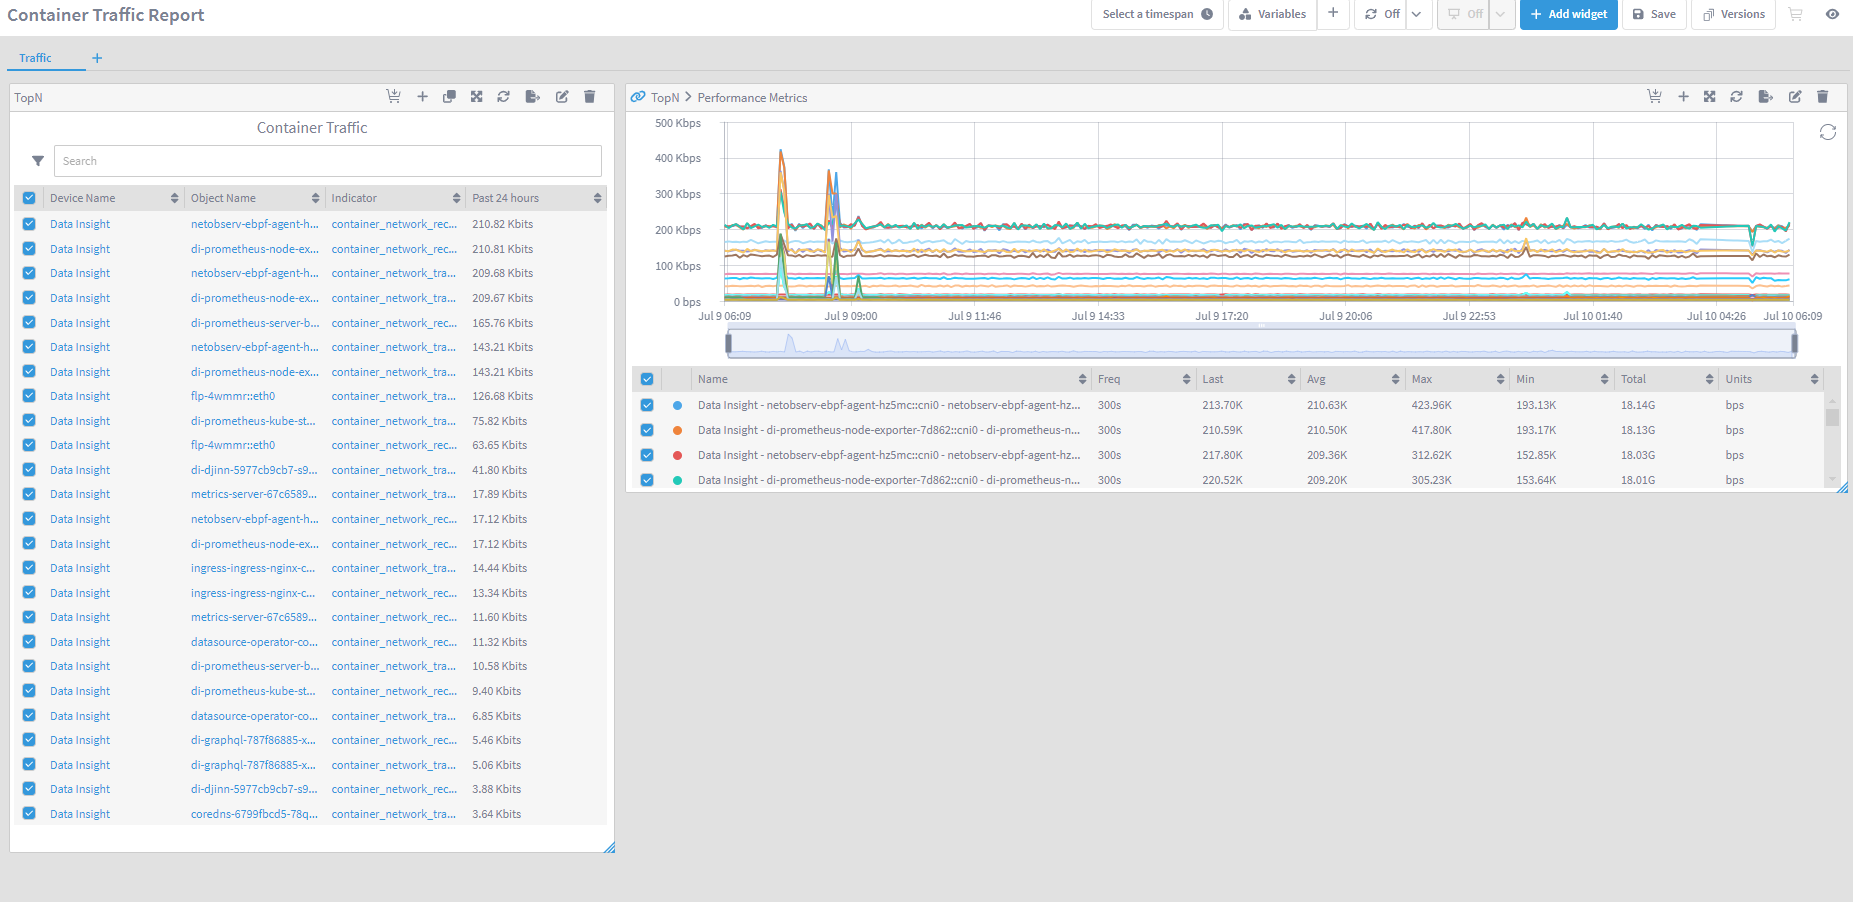
Click Create Report
a. Change Untitled Report for Container Traffic Report
b. Change Untitled Section for Traffic
c. Add Widget
i. TopN

    1. Select Type -> Device Group -> All Device Groups

    2. TopN View: Container Traffic

    3. Result limit: 25

    4. Click Run

    5. Edit the size of the widget to use almost all length of the report, and less than half of the width
NOTE : on new instances, it will take a couple of hours for the TopN report to show data. Don't panic if the TopN widget is empty
    ii. On the TopN widget, click on the + icon and select Performance Metrics

        1. Move the widget just right of the TopN widget

        2. Edit the size to half of the length of the TopN widget, and all the remaining width of the report
iii. On the Performance Metrics widget, click on the + icon and select Flow
Note : In Di 7.0.0 there is a bug that doesn't show flow data, continue to the next step to display some data]
Save the report
On the TopN widget select one container (recommended di-graphql container) to show how the selection is propagated to the PM widget and the Flow widget, showing us only the traffic generated by that container